
⏫ When we want to prioritize the next features to deliver, or the next initiatives to run, we have so many details to analyze. So many data points are involved.
👥 We want to ensure that we are helping our users to solve their problems efficiently. We want to be sure that we are providing a smooth and astonishing experience to our customers.
🎯 And at the same time, we want to ensure that we are supporting our business, that we are bringing enough revenues to ensure that we can continue to run our product for multiple years.
So when we start discussing priorities, everyone has their own ideas. Everyone thinks to know exactly where we should go next, with very strong beliefs. I am 100% sure I am speaking to your heart here. I am sure you’re experiencing this as well.
If we are working in a company that is operating in a market with a lot of uncertainty, it’s even harder. Starting a brand new product, like most startups are doing, makes this task even more complicated.
 We are all having the same challenge: being able to keep the users in mind, while continuously supporting our business (aka “generating revenues”).
 So how can we prioritize when we are sure of nothing? What can we do to reduce the risk level? How can we stop being so fearful when we are prioritizing our next features?
The fear that we are experiencing when prioritizing is mainly due to the confusion created by all the details that we are humanly unable to manage. It’s simply too much!
And we are all feeling it. We are feeling lost in front of all the possibilities, all the data. And humans’ egos hate to feel lost. And when the egos jump in, the conflicts start.
 We generally end up in a situation where no one really agrees with the decision that is being made. Everyone is stressed that the final decision is not “the best”.
And we spend more time defining what “best” means than actually taking action and moving forward.
All these details lead to confusion: no one is able to be sure, and most of us feel lost in front of all the possibilities.
At the end of the day, everyone is frustrated, and we end up with poor prioritization, pushed only by the loudest persons around the table.
While we are fighting to decide who is right, and who’s not, we tend to forget the most important: serving our users!
 The solution is to acknowledge the uncertainty (and so the gut feeling). We are then able to prioritize by systematically using the same numbers and scale so that we can compare all of our uncertainties together.
⏫ Calculating the RICE Score is the best solution we ever used.
We applied it within large companies, as well as smaller startups. We run it for highly uncertain topics as well as more controlled situations.
It is pretty simple, so let’s see how to use it.
The RICE Score is composed of 4 components: Reach, Impact, Confidence and Efforts.
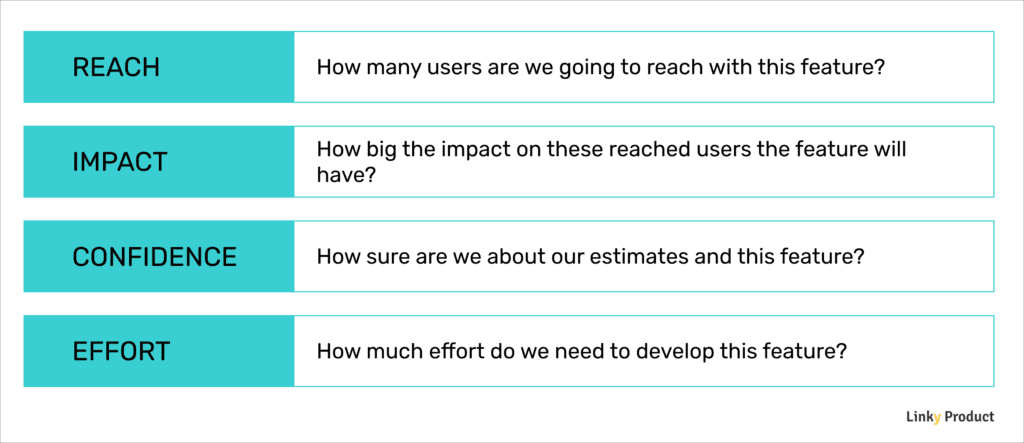
👥 Reach is the number of users that are going to use this feature. It measures how widely the initiative will spread through our userbase. It also gives us a sense of the risk that we are taking.
We must select the more realistic number possible.
The benefit of using this criterion is to take into account the number of users that we are going to impact. If we have two new features, one reaching 2 000 and the second 4 000, there is a good chance that the second has a higher priority.
 Here is an example:
- We have 10, 000 users
- We have the initiative to improve a feature currently used by 2,000 of these users. The goal is to have 1, 000 new users use this feature.
- The Reach of this initiative would be 3,000 users – 2,000 regular users + 1,000 new users.
 Impact is the degree of positive impact we are going to have on the reached users. It measures what the impact will be on the happiness of our users. It gives us a sense of what value we are delivering.
The benefit of integrating this criterion is that it will prioritize features that are envisioned to deliver more value to our users.
It’s based on a pretty simple scale:
- 3 = massive impact
- 2 = high impact
- 1 = medium impact
- 0.5 = low impact
- 0.25 = minimal impact
👍 Confidence is the trickier to explain, but probably the one that has the strongest value. It’s all about answering the question “How confident are you about the numbers that we are providing here?”.
The benefit of this criterion is definitely to acknowledge the gut feeling we are all having. We are putting a number on our feeling!
It’s a percentage, representing our Confidence level on the ranking that we are currently providing. How sure are we that the Reach is correct? How sure are we that the Impact is correct?
Here are some details that are impacting the Confidence level:
- Do we have user interviews validating that the feature is effectively solving a problem? If we do, the Confidence level is probably high!
- Do we have data to support our decisions on this feature? If we do, the Confidence level is probably higher as well.
- Is this feature coming only from internal discussions? The Confidence level should probably suffer a low Confidence level.
A rule of thumb that we are using is to avoid building features that have a Confidence lower than 50%. If an initiative has a low level of Confidence, it’s a sign that we have to run user interviews or find data to support our prioritization.
💡 One piece of personal advice here: this criterion often triggers discussion, as it can be hard to understand the first time we see it. It’s important to take time to explain it, and at some point to try anyway. The next prioritization sessions will be way easier, it’s just a matter to be used to it 😉
Finally, probably the easiest to explain: Effort 💼. It’s all about estimating, very high-level, how much time do we need to develop this feature.
Integrating Effort into the prioritization process has the benefits of ensuring that costs consideration is part of our decisions.
With the same idea as Reach and Impact, between a feature that will take 2 months or 6 months to develop, we all want to develop the less expansive feature 🙂
Depending on the context, we might use different scales, but the general rule is to use “person-months”. At Linky Product, we actually love to use a “team-month” basis.
So when estimating Effort, we are looking to answer this question: “How many months of my current team do I need to develop this feature?”.
So if the answer is “3 months”, the “E” score will be 3.